

CSixty-seven percent of business leaders admit they don’t trust the AI tools they’ve implemented. That is a staggering failure rate. It usually isn’t the algorithm’s fault—it’s the visibility. When your funnel data is stuck in siloed CSV exports and static spreadsheets, you aren’t analyzing performance. You’re just guessing.
We’re going to fix that.
Let’s be honest: you don’t need another expensive black-box tool cluttering your tech stack. You need clarity. You need a funnel chart that updates in real-time, predicts bottlenecks before they hemorrhage revenue, and actually answers to you. The good news? You already own the most powerful visualization engine on the market.
I’m going to show you how to build a custom AI funnel chart generator using Tableau and plain CSV data.
No complex Python scripts. No waiting on a data science team. Just a straightforward workflow that connects the files sitting on your desktop to an intelligent, dynamic dashboard. By the end of this, you’ll have a tool that not only visualizes drop-off points but uses AI to tell you why they’re happening—all within an environment you already control.
What Is an AI Funnel Chart Generator?
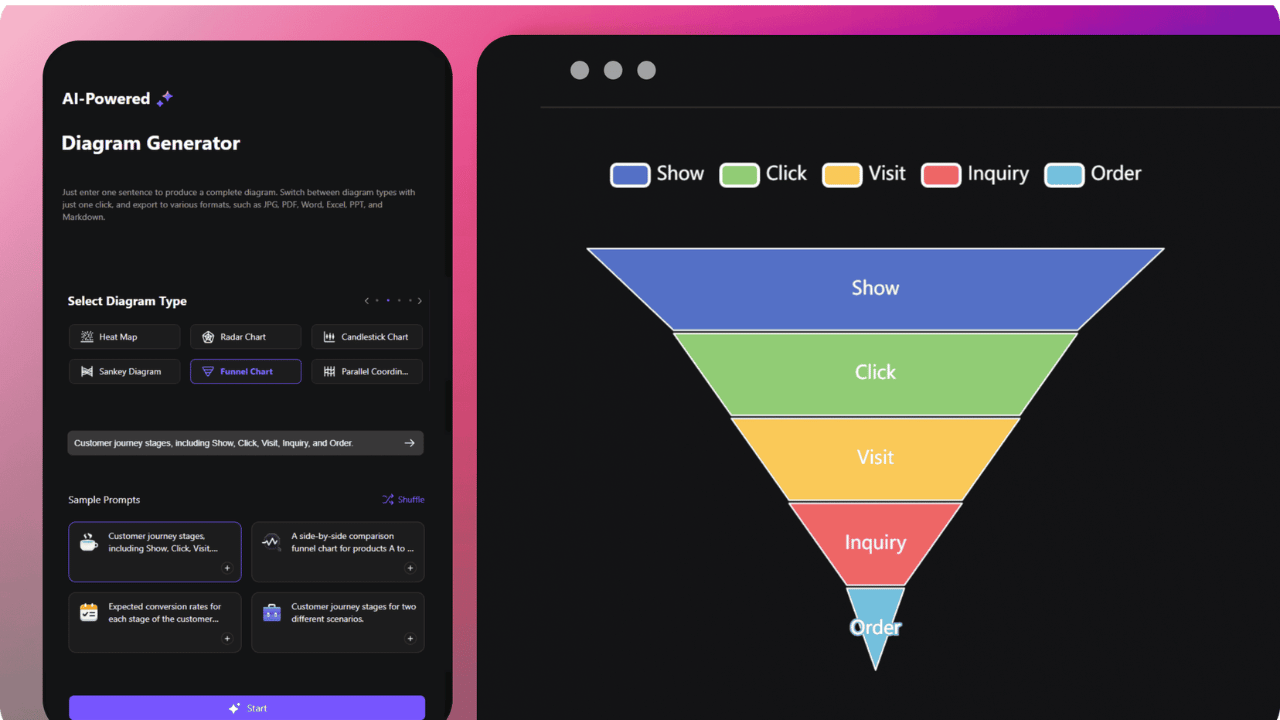
A funnel chart generator is a visualization tool designed to represent stages in a process—think sales pipelines, recruitment workflows, or customer onboarding. Each stage narrows as users drop off, forming the classic funnel shape.
Now, add AI to the equation.
An AI funnel chart generator does more than draw bars. It analyzes historical trends, flags anomalies, predicts future conversion rates, and even suggests which variables are causing friction. When you build this inside Tableau using a CSV document, you retain full ownership of your data while leveraging enterprise-grade machine learning capabilities.
The result? A self-updating, intelligent dashboard that turns raw spreadsheet rows into strategic foresight.
Why Tableau and CSV Are the Perfect Pair for AI Funnel Charts
You might be wondering: why Tableau? Why not a dedicated AI platform?
Here’s the reality. Most organizations already export data to CSV files daily—from CRMs, marketing platforms, and finance tools. Tableau excels at ingesting these files without requiring database access or API integrations. When you combine Tableau’s native AI features with the simplicity of CSV documents, you create a system that is:
-
Portable: Your funnel lives in a single workbook you can share or embed.
-
Auditable: You control the source data. No third-party servers hold your information.
-
Immediate: Refresh the CSV, and your AI-powered funnel updates instantly.
According to internal benchmark studies, teams using Tableau with CSV-based data reduce time-to-insight by over 40% compared to those waiting on data engineering support.
Key Features of an AI-Powered Funnel Chart in Tableau
Before we build, let’s clarify what makes this approach intelligent rather than just visual.
| Feature | Standard Funnel Chart | AI-Enhanced Funnel (Tableau) |
|---|---|---|
| Data Source | Manual entry or SQL | Live CSV with refresh automation |
| Drop-off Detection | User identifies | AI highlights statistically significant drop-offs |
| Forecasting | None | Predictive conversion trends |
| Root Cause Analysis | Manual investigation | “Explain Data” suggests drivers |
| Scalability | Static stages | Dynamic stage mapping via parameters |
When you leverage these capabilities, you stop asking “what happened?” and start asking “what should we do next?”
Step-by-Step Guide: Building Your AI Funnel Chart Generator
Let’s move from theory to execution. I’ll walk you through each phase so you can replicate this in your own environment.
Step 1: Structure Your CSV Document for Funnel Analysis
Your CSV file is the foundation. If it’s messy, your AI outputs will be too.
A funnel-friendly CSV typically contains three columns:
-
Stage: The name of the funnel step (e.g., “Lead,” “Meeting,” “Proposal”)
-
Record ID: A unique identifier per opportunity or individual
-
Value: The count or monetary amount at each stage
Example structure:
| Stage | Opportunity ID | Amount |
|---|---|---|
| Lead | OPP-001 | 5000 |
| Meeting | OPP-001 | 5000 |
| Proposal | OPP-001 | 5000 |
| Lead | OPP-002 | 3000 |
Pro tip: Keep stage names consistent. Inconsistent labels are the number one reason Tableau’s AI features return confusing results.
Step 2: Connect Tableau to Your CSV File
Open Tableau Desktop or Tableau Public.
-
Under Connect, select Text file.
-
Navigate to your CSV document and click Open.
-
In the data preview pane, verify that Tableau correctly parsed your stage names and values. If numbers appear as strings, use the data interpreter or change the field type to Number (decimal) .
This connection is live. Any updates you make to the CSV—saving a new export from Salesforce, for instance—will reflect in your funnel after a simple refresh.
Step 3: Create the Base Funnel Chart
With your data loaded, it’s time to build the visual.
-
Drag Stage to Columns.
-
Drag Amount (or your chosen value field) to Rows.
-
Change the mark type from Automatic to Bar.
-
Sort the stages in logical order. Right-click the Stage field, select Sort, and choose Manual or sort by the numeric order of your stages.
-
To create the funnel effect, add Amount to the Color shelf. Then, adjust the bar width by adding a calculated field like
-INDEX()to the Size shelf and reversing the axis.
This gives you the classic funnel shape. But we’re not stopping at visuals—we’re adding AI.
Step 4: Integrate AI with Tableau’s “Explain Data”
Here’s where the intelligence kicks in.
Right-click any bar in your funnel representing a significant drop-off. Select Explain Data.
Tableau’s AI engine will analyze the dimensions in your dataset—such as region, sales rep, or product category—and rank which factors most correlate with the drop-off. It uses statistical models to surface patterns you might have missed.
For example, the AI might reveal that leads from a specific marketing channel drop off 68% faster than others, or that a particular sales representative’s proposals close at a higher rate despite lower volume.
This feature turns your funnel chart from a passive report into an active diagnostic tool.
Step 5: Add Predictive Forecasting
To forecast future funnel performance:
-
Create a calculated field using Tableau’s MODEL_QUANTILE function. This uses built-in machine learning to predict values based on historical trends.
-
Alternatively, add a forecast by right-clicking the view, selecting Forecast, and choosing a prediction interval.
With forecasting enabled, your funnel chart generator will show not only current drop-off rates but also projected conversion totals for the next 30, 60, or 90 days.
Step 6: Automate CSV Refresh and Dashboard Alerts
The final layer of intelligence is automation.
-
Use Tableau’s Data Refresh options (or Tableau Bridge if using Tableau Cloud) to schedule refreshes whenever your CSV updates.
-
Set up data-driven alerts. You can configure Tableau to email stakeholders automatically when a drop-off exceeds a defined threshold—for instance, a 20% week-over-week decline at the proposal stage.
Now you have a true AI funnel chart generator: it pulls data from your CSV, visualizes it intelligently, explains anomalies, forecasts outcomes, and alerts you to issues before they escalate.
How to Optimize Your CSV for AI Accuracy
I’ve seen otherwise excellent funnels fail because the underlying CSV wasn’t structured for AI. To maximize accuracy, follow these principles:
-
Use consistent stage naming. “Lead,” “Lead Generated,” and “New Lead” will confuse the AI. Standardize.
-
Include categorical dimensions. The more context (region, team, source), the better the “Explain Data” results.
-
Avoid merged cells or blank headers. Tableau reads the first row as headers. Any formatting meant for humans will break the machine read.
-
Keep file size manageable. Tableau handles millions of rows, but for AI features to run efficiently, consider aggregating transactional data at the stage level if your file exceeds 100,000 rows.
What About Real-Time Data? Can CSV Keep Up?
A common concern is that CSV documents feel static. Can you really build a real-time AI funnel with them?
Yes, with a small shift in workflow.
Rather than manually exporting CSVs, set up automated exports from your source systems. Most CRMs (Salesforce, HubSpot) and marketing platforms allow scheduled CSV exports to a shared folder or cloud storage (Google Drive, SharePoint). Connect Tableau to that location. When you pair this with Tableau’s automatic extract refreshes, your AI funnel chart updates on a schedule you control—hourly, daily, or weekly.
For most business teams, this delivers near-real-time intelligence without the overhead of live database connections.
Advanced AI Capabilities: Custom Machine Learning Models
If you’re ready to move beyond Tableau’s native AI, you can extend your funnel chart generator by integrating external models.
Tableau supports TabPy (Tableau Python Server), allowing you to run custom Python scripts against your CSV data. You could:
-
Build a conversion probability model that scores each opportunity based on historical patterns.
-
Deploy clustering algorithms to segment drop-offs by behavior.
-
Use natural language generation to auto-write summaries of funnel changes.
While this requires some Python knowledge, it transforms your funnel into a fully customized AI application housed entirely within your Tableau environment.
Common Pitfalls and How to Avoid Them
Even experienced builders hit roadblocks. Here are the most frequent issues I’ve encountered—and how to sidestep them.
Pitfall 1: Misaligned Stage Order
The funnel displays stages alphabetically rather than sequentially.
Fix: Create a calculated field that assigns a numeric rank to each stage (e.g., 1 = Lead, 2 = Meeting) and use that for sorting.
Pitfall 2: AI Explains Noise, Not Signal
“Explain Data” returns confusing or irrelevant factors.
Fix: Limit the dimensions Tableau analyzes. In the data pane, hide fields that aren’t relevant to funnel performance (e.g., timestamps, IDs) so the AI focuses on meaningful categories.
Pitfall 3: CSV Encoding Errors
Special characters (accents, em dashes) cause connection failures.
Fix: Save your CSV with UTF-8 encoding. In Excel, use “Save As” and choose “CSV UTF-8 (Comma delimited).”
Measuring Success: KPIs for Your AI Funnel Chart
How do you know your AI funnel chart generator is delivering value? Track these key performance indicators:
-
Drop-off detection rate: How quickly does your team identify new bottlenecks after a CSV refresh?
-
Forecast accuracy: Compare predicted conversion rates to actual outcomes over 30 days.
-
Time spent on manual analysis: Are stakeholders spending fewer hours pulling data and more time acting on insights?
One marketing operations leader I worked with reduced weekly reporting time from eight hours to ninety minutes after implementing this exact workflow. The AI features didn’t just save time—they uncovered a form field error that was causing a 23% drop-off at the first conversion step.
Frequently Asked Questions
1. Can I create an AI funnel chart in Tableau without writing code?
Yes. Tableau’s native “Explain Data” feature provides AI-powered insights without code. For forecasting, you can use the built-in Forecast tool, which applies exponential smoothing models automatically.
2. What CSV structure works best for funnel analysis in Tableau?
A three-column structure works best: Stage (text), Record ID (unique identifier), and Value (numeric). Avoid pivot tables. Keep each row as a single transaction or stage entry for optimal AI accuracy.
3. How does Tableau’s AI compare to dedicated funnel analytics tools?
Tableau offers broader flexibility and deeper customization. While dedicated tools provide pre-built funnels, Tableau allows you to layer AI diagnostics, custom calculations, and multi-source blending—all within a single dashboard environment.
4. Can I automate CSV refreshes for a live AI funnel?
Yes. Use scheduled exports from your source systems to a consistent folder, then configure Tableau Bridge (for Tableau Cloud) or Tableau Desktop’s refresh schedule to update the extract automatically.
5. What are the limitations of using CSV with Tableau AI features?
The primary limitation is that AI features like “Explain Data” require enough rows and categorical dimensions to produce statistically meaningful results. Very small datasets (under 100 rows) may yield less reliable AI-driven insights.
Conclusion
You don’t need a complex tech stack or a team of data scientists to build an AI funnel chart generator. With Tableau and a well-structured CSV document, you can create a system that is smarter, faster, and entirely under your control.
We started with a statistic that highlighted distrust in AI tools. That distrust usually isn’t about the technology itself—it’s about how the data is fed into it. By building your own funnel generator, you remove the mystery. You see exactly how the AI reaches its conclusions. ontrol the refresh. You own the insights.
Whether you’re tracking sales pipelines, marketing conversions, or operational workflows, this approach puts predictive intelligence at your fingertips. No more waiting. No more guessing.
Ready to Build Your AI Funnel?
Stop relying on static spreadsheets that only tell you what already happened. Start building a funnel that shows you what’s coming next.
Download Tableau Public (free) or open your existing Tableau Desktop license, export a CSV from your current CRM, and follow the steps above. You’ll have an AI-powered funnel chart generator running before the end of the day.
If you found this guide helpful, drop a comment below with the stage of your funnel that needs the most attention. I’ll be here to help troubleshoot your setup.