
In trading, identifying trend reversals at the right time is very important. Because if you enter the trade too early, you might get caught in a continuation loop, and if you enter too late, you will make less profit. The ability to capture trend reversals at the right time will drastically improve your trading results.
There are various indicators available in the market that can signal trend reversals, but price action usually provides the clearest signals. The two-candle signal is one of the most trusted price action signals that most traders rely on. Traders can spot reversals early in time with the help of a two-candle pattern.
What Is a Two-Candle Reversal Pattern?
A two-candle reversal pattern forms when two consecutive candlesticks indicate a potential change in the trend direction. In this pattern, the first candle continues in the previous trend, while the second candle shows a strong move in the opposite direction.
This shows the shift in control. Buyers or sellers are losing control, and the opposite side is getting dominant. These patterns are commonly seen in intraday trading, swing trading, forex, and commodity markets.
However, context is crucial. The pattern works best when it appears after a clear uptrend or downtrend. Also, increased volume can be an additional confirmation. Traders use a screener to filter and identify stocks that are forming two-candle reversal patterns.
Types of Two-Candle Patterns
Depending upon where the pattern appears, the two-candle pattern is divided into two types.
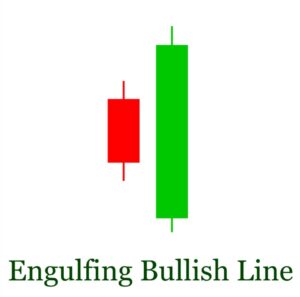
1. Bullish Engulfing Pattern
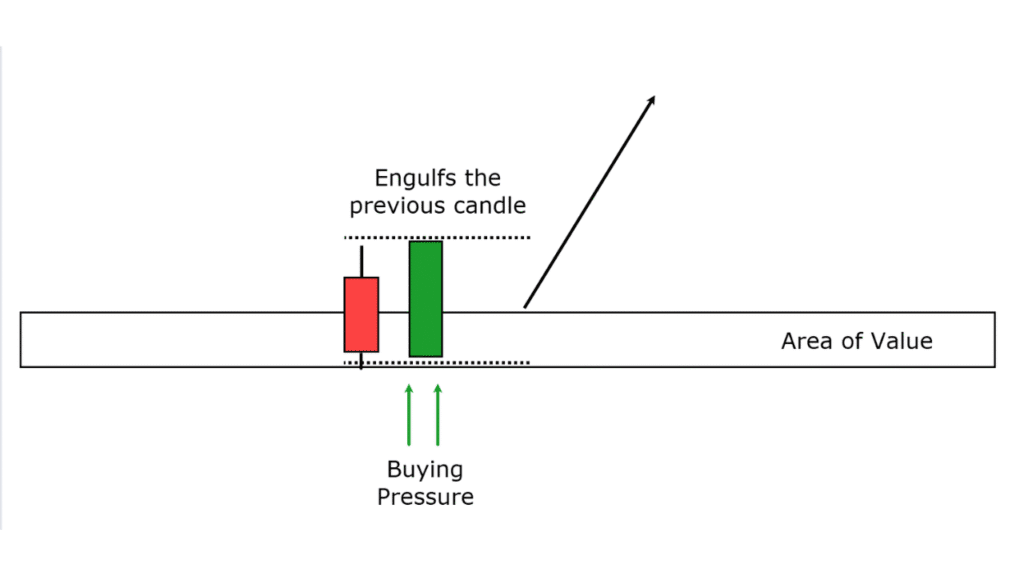
In this pattern, the first candle is a small bearish red candle followed by a large green candle, which engulfs the previous red candle completely. A bullish engulfing pattern forms after a downtrend and signals a potential upward reversal. Refer to the figure below.
What It Means:
Sellers were in control during the first candle. But in the next session, buyers enter aggressively and overpower the sellers. This sudden shift indicates increased bullish momentum.
How to Trade:
- Enter after the second candle closes.
- Place a stop-loss below the low of the pattern.
- Target a minimum risk-reward ratio of 1:2.
The pattern becomes stronger if it forms near a key support level or after an oversold condition.
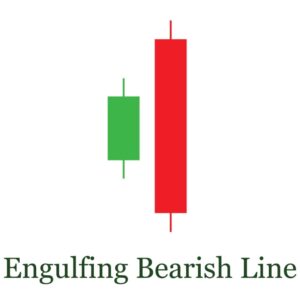
2. Bearish Engulfing Pattern
During such pattern formation, buyers were pushing prices higher, which can be seen in the green candle. The second candle is red and larger in size, which shows increased seller pressure, and they are in control now.
The Bearish Engulfing pattern forms after an uptrend and suggests a potential downward reversal. Conversely to the bullish engulfment, the first candle is a small bullish candle, and the second candle is a large red candle that engulfs the body of the first candle. Refer to the figure below:
How to Trade:
- Enter short after confirmation (candle close).
- Stop-loss above the pattern’s high.
- Aim for a structured risk-reward setup.
This pattern works best near resistance levels or after overbought conditions. Similar to the Bearish Engulfing pattern, the Dark Cloud Cover pattern also signals a potential downside reversal, especially when it appears near strong resistance levels. The only difference is that Dark Cloud requires that the red candle only covers 50% of the body of the previous day’s candle.
How to Trade the Two-Candle Reversal Pattern Effectively
By following the structured approach, you can improve your trading accuracy for the two-candle reversal pattern.
- Identify a clear trend – This pattern must appear after an uptrend or a downtrend. Formation of such patterns during a sideways market can be a false signal.
- Wait for candle close – Let the pattern form completely to avoid false signals.
- Use Confluence – The probability of reversal increases if you combine this pattern with support and resistance levels, trendlines, volume spikes, and RSI divergence.
- Manage Risk – Always use stop-loss and maintain proper position sizing.
Final Thoughts
The two-candle pattern is a simple and effective pattern that most traders use during price action trading. Formation of such a pattern after a clear trend and at key levels can be more reliable.
Practice identifying these setups on historical charts, backtest them on your preferred timeframe, and combine them with proper trade management. It will help you develop confidence and use this pattern effectively in live markets.